|
Following are the adjusted arrival times for all four legs. These are based on the physical arrival times at the pit stops (or finish line), except that teams that completed more clue locations are always ahead of teams that completed fewer. These arrival orders were used to calculate the score for the leg.
Leg 1
| Order | Team |
| 1 | SS Pancake Wagon |
| 2 | Golden Nugget |
| 3 | XX-Coeds |
| 4 | Bloodstar Boneship |
| 5 | Sharkship One |
| 6 | Mystic Fish |
| 7 | Here Be Dragons |
| 8 | Encrypterprise |
| 9 | Heart of Gold |
| 10 | Snout |
| 11 | Pimp My Ship |
| 12 | Tiger Pit |
| 13 | Fortnight Grouse |
| 14 | Haberdasher |
| 15 | Mithril Battle Chickens |
| 16 | Drunken Robots |
| 17 | Serenity |
| 18 | The Basil Lover |
| 19 | The "B" Ark |
| 20 | Interplanet Janet |
| 21 | Mystery Meat Machine |
| 22 | Mealy Towel |
|
Leg 2
| Order | Team |
| 1 | Here Be Dragons |
| 2 | SS Pancake Wagon |
| 3 | Golden Nugget |
| 4 | Bloodstar Boneship |
| 5 | Sharkship One |
| 6 | Pimp My Ship |
| 7 | Mithril Battle Chickens |
| 8 | XX-Coeds |
| 9 | Heart of Gold |
| 10 | The Basil Lover |
| 11 | Mystery Meat Machine |
| 12 | Encrypterprise |
| 13 | Fortnight Grouse |
| 14 | Snout |
| 15 | Serenity |
| 16 | Mystic Fish |
| 17 | Tiger Pit |
| 18 | Mealy Towel |
| 19 | The "B" Ark |
| 20 | Haberdasher |
| 21 | Drunken Robots |
| 22 | Interplanet Janet |
|
Leg 3
| Order | Team |
| 1 | Golden Nugget |
| 2 | SS Pancake Wagon |
| 3 | Here Be Dragons |
| 4 | Bloodstar Boneship |
| 5 | Encrypterprise |
| 6 | Mystic Fish |
| 7 | Snout |
| 8 | The "B" Ark |
| 9 | Sharkship One |
| 10 | Heart of Gold |
| 11 | XX-Coeds |
| 12 | The Basil Lover |
| 13 | Pimp My Ship |
| 14 | Serenity |
| 15 | Interplanet Janet |
| 16 | Haberdasher |
| 17 | Drunken Robots |
| 18 | Fortnight Grouse |
| 19 | Mystery Meat Machine |
| 20 | Mithril Battle Chickens |
| 21 | Mealy Towel |
| 22 | Tiger Pit |
|
Leg 4
| Order | Team |
| 1 | SS Pancake Wagon |
| 2 | Snout |
| 3 | Golden Nugget |
| 4 | Bloodstar Boneship |
| 5 | XX-Coeds |
| 6 | Mithril Battle Chickens |
| 7 | Sharkship One |
| 8 | Mystic Fish |
| 9 | Pimp My Ship |
| 10 | The Basil Lover |
| 11 | Interplanet Janet |
| 12 | Here Be Dragons |
| 13 | Heart of Gold |
| 14 | Mystery Meat Machine |
| 15 | Fortnight Grouse |
| 16 | Tiger Pit |
| 17 | Encrypterprise |
| 18 | Haberdasher |
| 19 | Serenity |
| 20 | Mealy Towel |
| 21 | The "B" Ark |
| 22 | Drunken Robots |
|
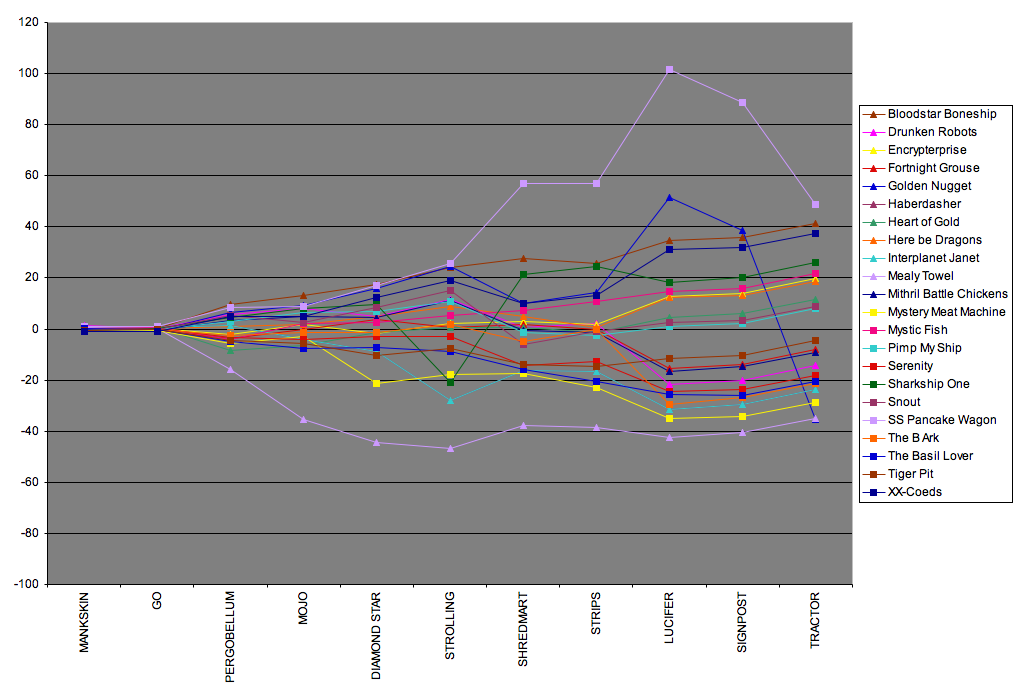
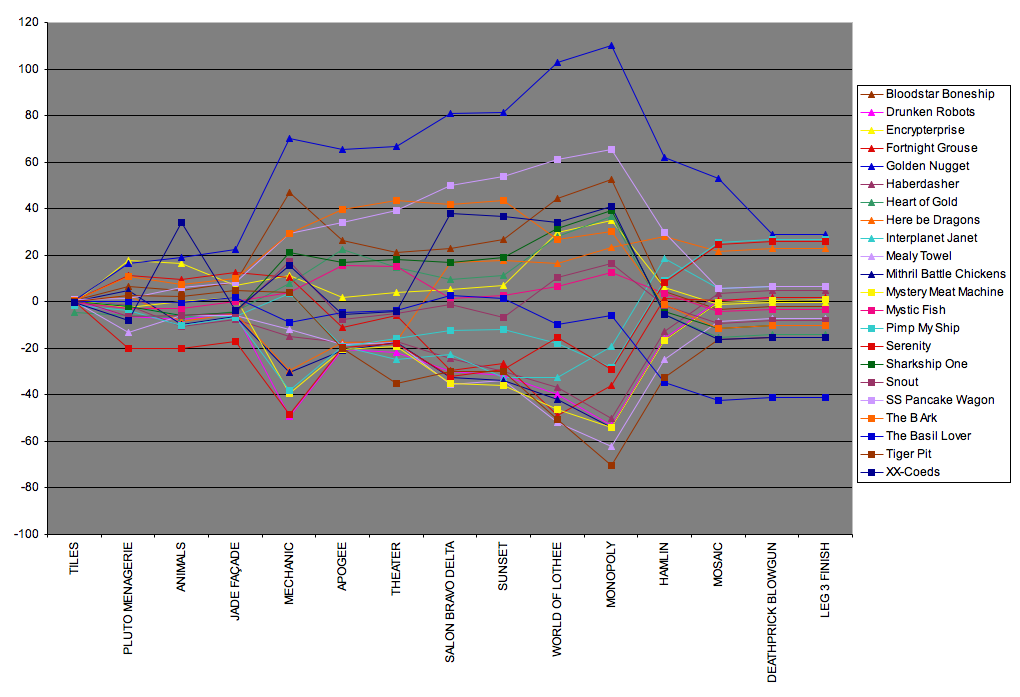
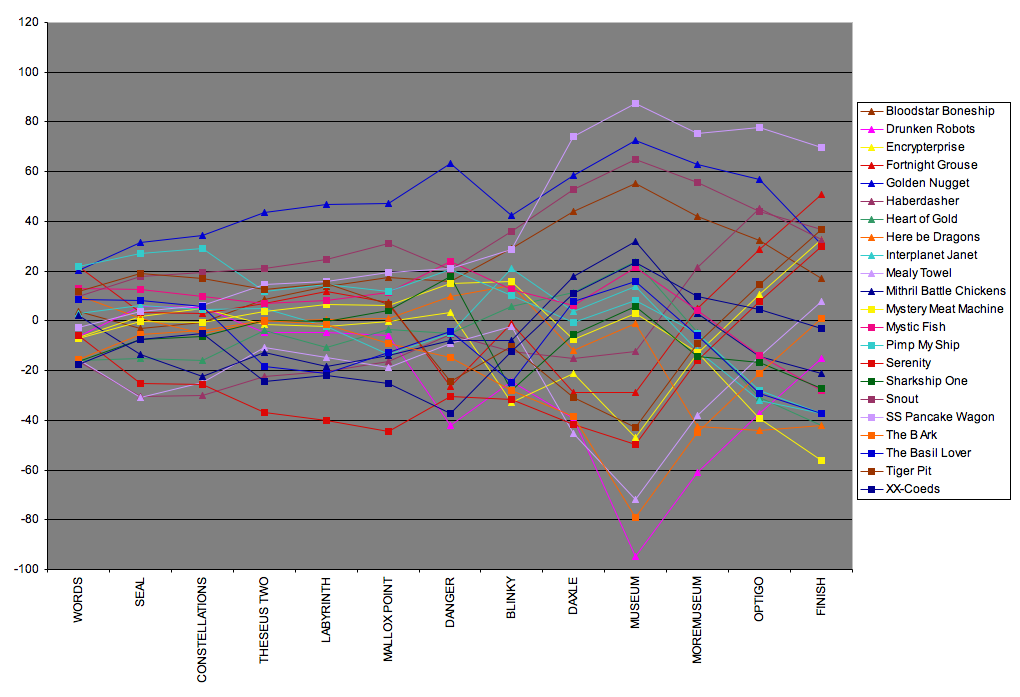
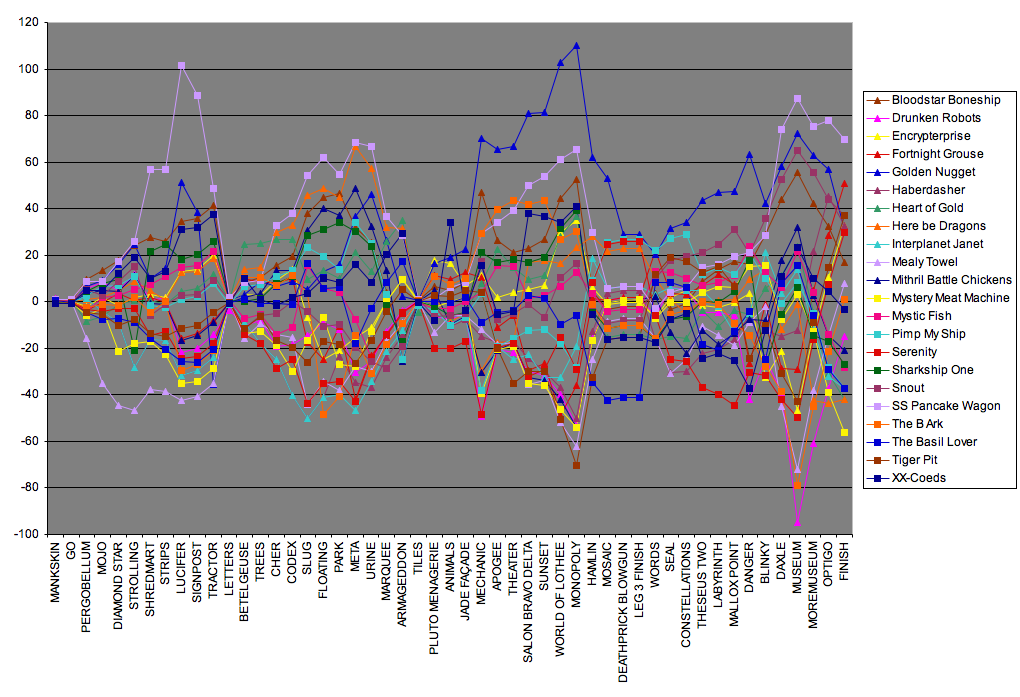
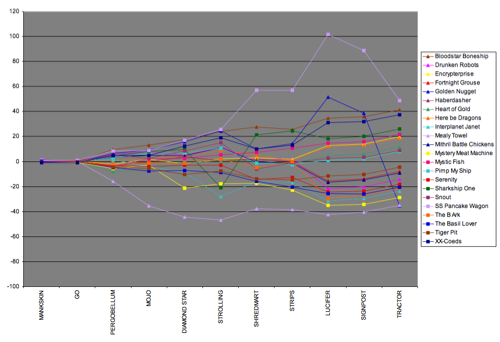
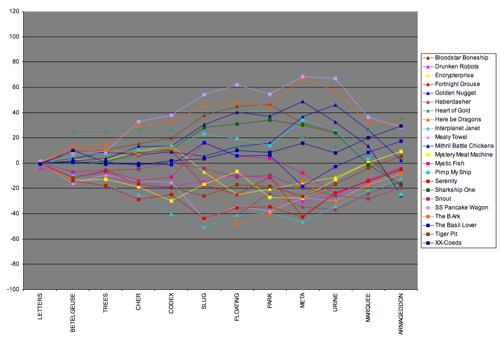
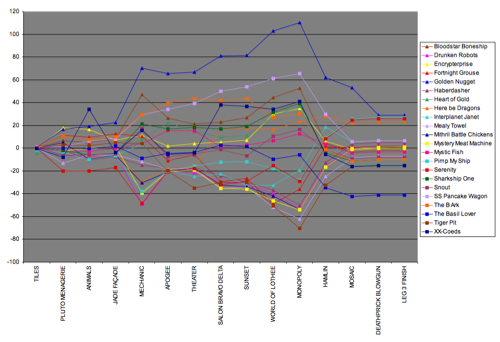
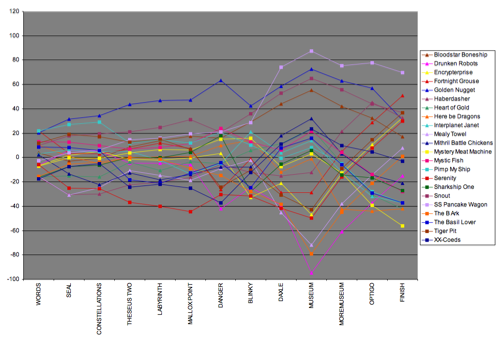
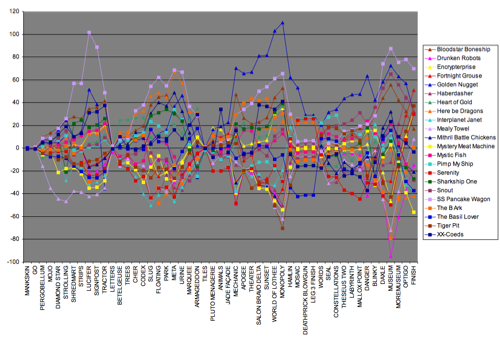
These charts show how many minutes ahead or behind the average each team was at each location. The charts do not account for clue skippage, so they diverge from the official arrival orders toward the end of each leg. The fifth chart is just a concatenation of the first four. Click on the images for larger versions.
|